Tuesday, November 15, 2005

Regression Tree for (0,2) vs. Optimal Solution


This regression tree was generated with binary arc states. The treefit function was called with a list of all possible combinations of arc costs and was regressed against the list of corresponding optimal solutions.

Although this tree is different than the one given below, I believe that they contain equivalent information. Since the problem is symmetric, arcs 1 and 7, 2 and 8 and so forth should have equivalent prediction power.

Regression Tree For (0,2,Unknown) vs. Optimal Solution


This regression tree was generated as the result of running Matlab's treefit function. The input variables were the states of the arcs and the value of the optimal solution based on the arc states. The arc states could take on one of 3 possible values:(zero, two, unknown), where zero and two represent possible arc costs for arcs that have been examined, and unknown is used to indicate that the arc cost is not known. If an arc were in the unknown state, it was also assigned an arc cost of 2.

All possible arc state combinations were generated, mapped to an arc cost vector and solved optimally. The list of arc cost states and the corresponding list of optimal solutions were regressed to generate this tree.

The nodes of the tree predict the actual solution generated by having gone down a branch.

Monday, November 14, 2005

Infinite Horizon Using Average Cost Per Stage


I had the idea of using the metaplanning policy for the unit square graph and replicating it infinitely many times so that I would have a metaplanning solution for an infinite chain of squares. This is a simple example that shows that it is possible since it is easy to mape the unit square graph onto this example.

Wednesday, November 09, 2005

List of Experimental Configurations


These diagrams show the various graph configurations for the various experimental results given below.

Monday, November 07, 2005

Generic MDP Results for New Graph 4


These are results for the cross to one side configuration for the New Graph using samples from a uniform [0,2] random variable for each arc. I discretized to 5 quality levels. It appears that the benefit of metaplanning is not a significant here, which may be due to the way I discretized. The discretization was done by splitting the total cost interval into equal parts. Of course this does not mean that the intervals occur with equal probability, since most of the probability mass is concentrated in the center.

But this does show that it is possible to use my code for arbitraty discretized distributions.

Generic MDP Results For New Graph 3


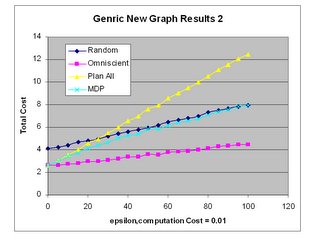
These are result of the generic MDP for the New Graph, where it is possible to cross to the other side for a particular path.

Generic MDP Results For New Graph 2


These are result for the generic MDP where one side has an alternative path.

Generic MDP Results For NewGraph 1


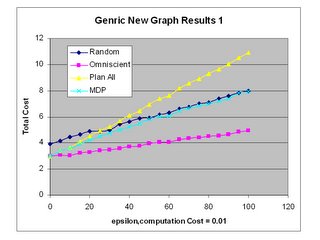
These are results for the New Graph Configuration with the middle node taken out.

Generic MDP Results for New Graph 0


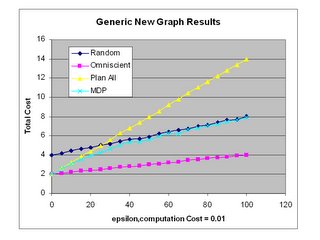
These are result of the relatively generic meta planner for the New Graph Configuration. All arcs are discrete [0,2] with equal probability.

Wednesday, November 02, 2005

Observarions on Matlab Code Problems

1.Main observation, all of the calls to my qualityEval() function takes up to 0.1 sec. over 32000+ loops this is significant. Rather than calling a separate function, I have a matrix in my code that directly maps path costs to quality levels.

2.I tried converting my Matlab function into c code using mcc but it actually took longer to execute in c then it does in Matlab.

2.Using the find function in place of for loops seemed to slow my code down.